Elliott Wave History
“Phenomenal Trader is a combination of Quality Education
and Hard Work“
We are going to start the journey to becoming a successful trader from level zero. Before we dive into Elliott Wave, however, there is one thing you need to promise me!
Keep reading carefully…
While you read this “Elliott Wave Black Book”, you are going to learn that Elliott Wave Theory has a lot of rules that you need to follow. I want to make sure you work a little bit each day. I would suggest that after each chapter (starting from chapter 2) you should pull up your favorite charting software and start searching for patterns and check them against the rules you just read about.
If you think just reading the book will make you a better trader, stop wasting your time and mine! I only work with winners, not time-wasters!
I’ll give you 15 seconds to think about your next move. Either promise yourself that you are going to work hard, or find another profession!
Yes, I Want To Become A Phenomenal Trader!
Excellent! Since you are still reading my book, I know you want to become a successful trader. Now, it’s time to learn something about Elliott Wave Theory.
Elliott Wave Theory might not be the oldest trading theory, but it is definitely the most profitable one I learned in my trading career. Like in any other field where we want to master, we need to start from beginning, and Elliott Wave began almost 100 years ago with Ralph Nelson Elliott.
You may already guess that R.N.Elliott was the father of this great theory! But let me tell you his story…
He started a career in the finance world, but not as trader like a lot of people think. Elliott’s earliest connection with our industry came from working as an accountant in the U.S. Even during this period of his life, he showed a potential to teach others, and he published two books Tea Room and Cafeteria Management and The Future of Latin America.
One of his biggest passions was traveling, but this passion ruined his accounting career. After one of his visits to Central America, Elliott picked up a strange illness that forced him to retire young.
This man was a fighter. He didn’t just give up and waited for the end! No, instead of giving up, Elliott started to chase another passion, “Learning How the Stock Market Works.” It is this part of his life where we are going to focus in this book.
In the early twentieth century, stock market data wasn’t available as it is now. Back in days of R.N., if you wanted to get a chart, you needed to print or draw everything manually.
In his search for cracking the market code, Elliott started with the charts of the DOW JONES. He started analyzing thousands and thousands of charts of this instrument, from monthly all the way to the 15-minute time frame.
After a lot of hard work, he found something interesting…
R.N.Elliott’s Big Discovery
R.N. Elliott discovered that in volatile markets every move, either trend or pullback, can be identified early. His study showed that crowd behavior forms group of patterns. In total, he discovered thirteen patterns that constantly repeats in all instruments. After that, he managed to discover that we can see identical patterns in each time frame. If we look closer at those patterns, we can see that patterns spotted on smaller time frames link to identical pattern on higher time frames. In this moment, 100 years later, we know these thirteen patterns as Elliott Wave patterns.
Two Cycles Inside The Market Moves!
As I just mentioned, in total we have thirteen patterns that R.N Elliott discovered. To make everyone’s life easier and simpler, he separated all these patterns into two phases: the “Motive Phase” & the “Corrective Phase”.
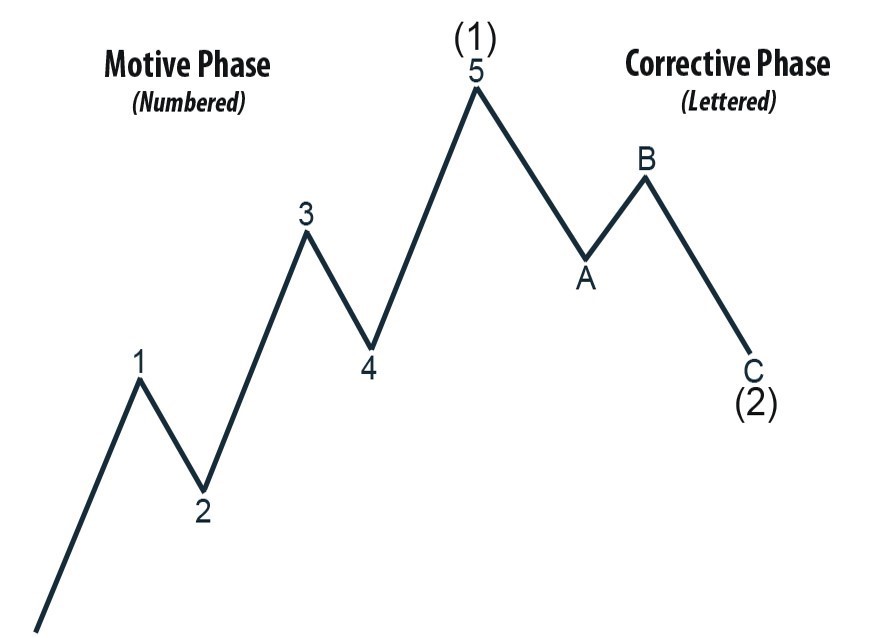
The image above shows a graphical representation of two phases that we need to learn next.
The Motive Phase represents a larger trend, and all the patterns we are going to learn from this phase are going to be found inside direction of the larger trend.
The Corrective Phase represents pullbacks in the trend patterns. So each pattern from this group should be found in moving in the opposite direction of the larger trend.
The Fractal Nature Of The Market
Everyone who opened the chart of any instrument (It doesn’t matter if it’s Forex, Stocks, Commodities…) has noticed that the market can’t just move in one direction all day long. The market is always going to move up and down during the trading day.
So here is where Elliott’s discovery comes in handy. We know that the market is going to form identical patterns on all time frames, and if we connect them, we are going to see the same pattern – just on a larger time frame.
Now it’s a time to check the next image. Imagine the image below as a 1-hour (1H) chart of any pair. I’ll explain you why shortly…
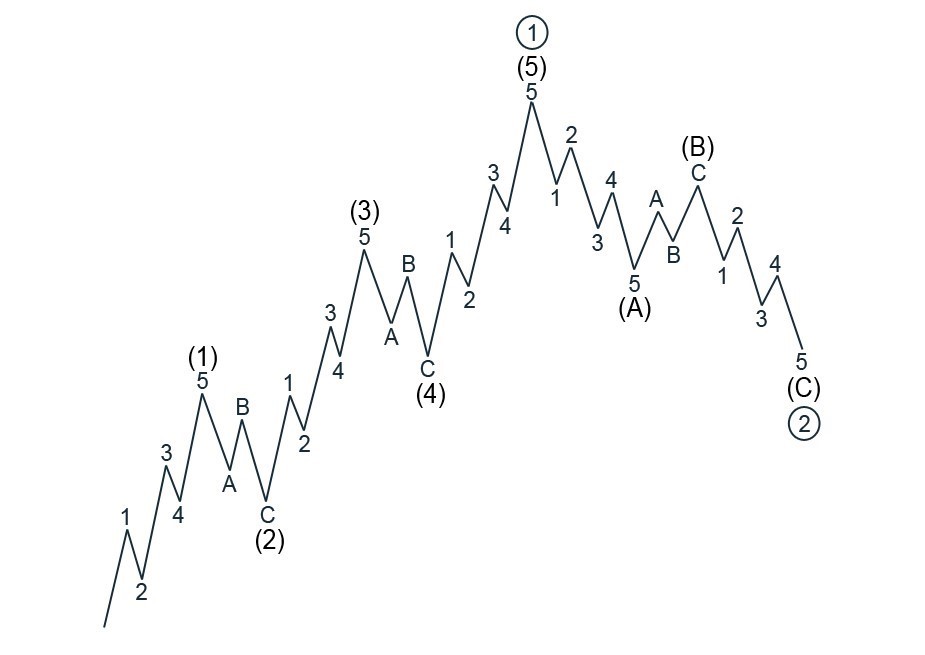
Now take a look at the first waves, (1) and (2), closely. You’ll notice that we have five waves up, followed by three waves down. Look at the entire pattern: (1) (2) (3) (4) (5), (A) (B) (C). Again, we have five waves up followed by three waves down.
I suggested you imagine this entire chart as a 1-hour chart. Now you can see that the first (1) (2) represent the Elliott Wave patterns on the 15-minute time frame, and just by linking each pattern we get that identical pattern on the 1H timeframe.
But wait, that’s not everything… Remember that R.N. told us that we can see same patterns on every time frame…
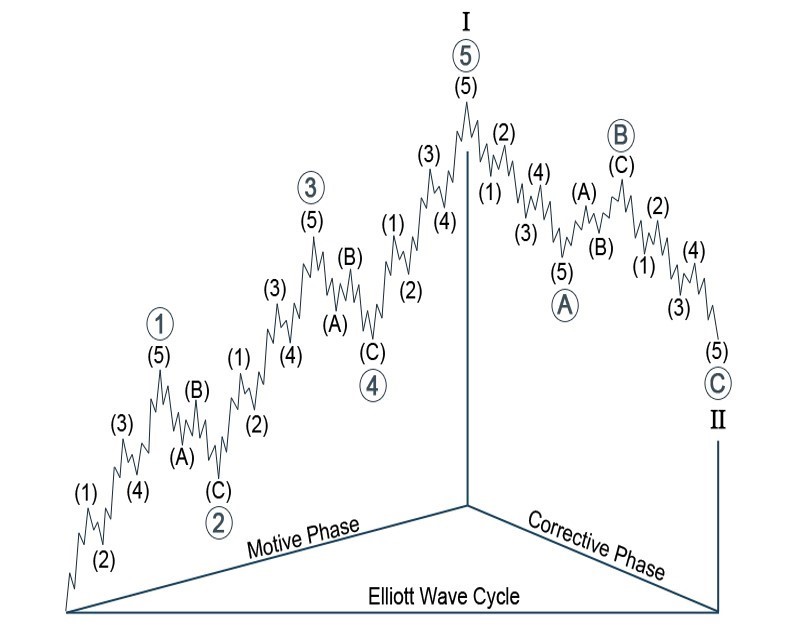
On the image above we can now see a lot more waves, right? But don’t let that confuse you, there will always be an easy option for looking at waves. First imagine waves [1][2][3][4][5], [A][B][C] as a 4-hour chart, and the smaller waves (1)(2)(3)(4)(5), (A)(B)(C) as 1H chart and the smallest 1 2 3 3 4 5, A B C as 15-minute chart.
It is always going to be same. When a smaller pattern is complete, it is just the end part corresponding to the larger time frame. Everything will start to make more sense fast, when we start watching labeled charts in the next chapter.
What Have We Learned In This Chapter…
Today you’ve learned a small history of Elliott Wave Theory. This part may not seem too interesting, and I know that. But you still need to go slowly.
The only thing I ask you to do before you move to the next chapter is going to be to memorize how the two phases should look (Image 1 – 2 -3).
When you are sure you understand the basic idea of how both cycles of the market should look on your chart, then move to the next chapter.