
Welcome To Chapter One
Motive Phase
The time has come to start learning patterns one by one. Since R.N. Elliott divided the market cycle into two phases, we should start learning patterns from easiest to hardest. We are going to start learning patterns from the Motive Phase group.
This group of cycles have only four patterns: Impulsive Wave, Extended Wave, Leading Diagonal, and Ending Diagonal. Each pattern appears in the direction of a larger trend.
While this may seem complicated and confusing when you hear that you need to learn four patterns, all the patterns have a lot of things in common.
What Motive Patterns Have in Common?
Every Motive Pattern must take a form of a five wave structure. To make the separation between the motive and corrective phases easier, we are going to use the numbers 1, 2, 3, 4, 5 to label the motive phase.
From this five wave structure inside each motive pattern, waves 1, 3, and 5 represent trend waves, while waves 2 and 4 represent countertrend moves after waves 1 and 3.
To make the learning process easier for everyone, we are going to separate all four patterns into smaller groups.
- Impulsive Group (Impulsive Waves)
- Extended Group (Extended Waves)
- Diagonal Group (Leading and Ending Diagonals)
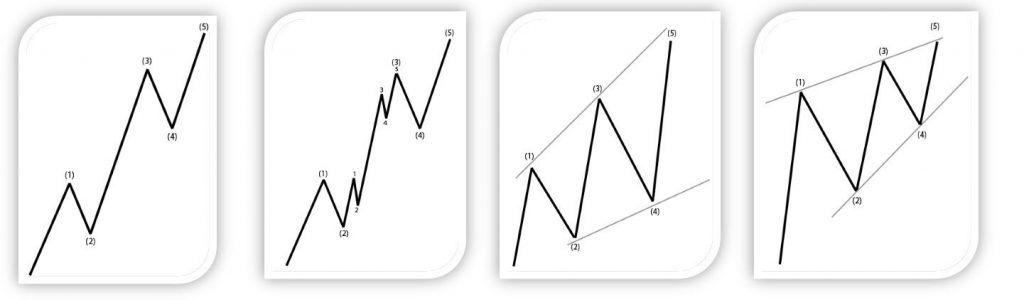
On the image above you can see a visual representation of the three groups where we put our four motive patterns.
Basic Nature of the Five Wave Structure.
Wave 1 – A slow but steady move after trend is ready to change. Since traders that are not ready to give up on a previous trend, you can see some choppy movements in this wave 1.
Wave 2 – The first correction inside larger trend, often a sharp and strong move against the previous wave 1. Rookie traders play a big part in this wave, they force it to push in the direction of larger trend, but that fails pretty fast after we start wave 3.
Wave 3 – A strong and sharp move when traders give up the idea of the previous trend and start getting optimistic about building new positions from the highs/lows. During this wave 3 it’s not so strange to see a decent amount of news support that trend change.
Wave 4 – A small correction after a big spike in wave 3. This wave is in reaction to some news impact that doesn’t last too long, and just squeezes a few stops from day traders before we resume a trend.
Wave 5 – The final but sharp move in the direction of the larger trend. This is the wave larger banks like to use to book their profits while new traders still optimistic about the trend continue to add to position.
This Part Of Elliott’s Big Discovery You Need To Remember!
Before we move on with learning the first pattern, I just want to remind you about Elliott’s big discovery:
“Elliott found 13 patterns that appear in all markets and all time frames. These patterns link each other to form a larger version of those same patterns.”
It’s important to remember this idea before we dive into Motive Phase… To make it easier for you remember that if you find 5w pattern on daily chart, you should see few similar patterns on 4h time frame.
Impulsive Group
Impulsive Waves
One of easiest and most common Motive patterns to spot in the market every day are Impulsive patterns. Like other patterns from this group (Motive), Impulsive waves are built from a five wave structure that forms in the direction of a larger trend.
From this five-wave structure that we have inside the Impulsive pattern, waves 1,3, and 5 are trend waves and move in a direction of larger trend, while waves 2 and 4 represent the short term pullback within the larger trend.
Impulsive Pattern Sub Waves
- Waves 1, 3, and 5 are going to be Motive themselves: inside each of these three waves we are going to see another five-wave structure on smaller scale.
- Wave 2 and 4 are going to have a corrective sub-structure and we are going to have smaller three wave patterns inside.
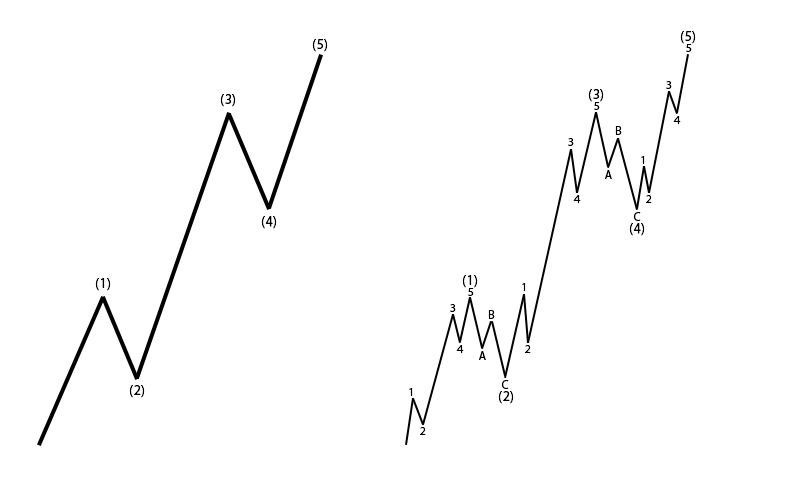
On the image above left you can see how the Impulsive wave should appear in the market and on the right you can see how a full Impulsive pattern can look with all its sub-waves.
For an Impulsive wave to be called valid, it must respect a few rules, so don’t even bother skipping this part!
Impulsive Wave Rules
- Rule One: Wave 2 must complete above/below starting point of Wave 1.
- Rule Two: Wave 3 is often the longest but never the shortest of waves 1,3,5
- Rule Three: Wave 4 can’t enter Wave 2 Territory
Impulsive Wave Example (Bull Market)
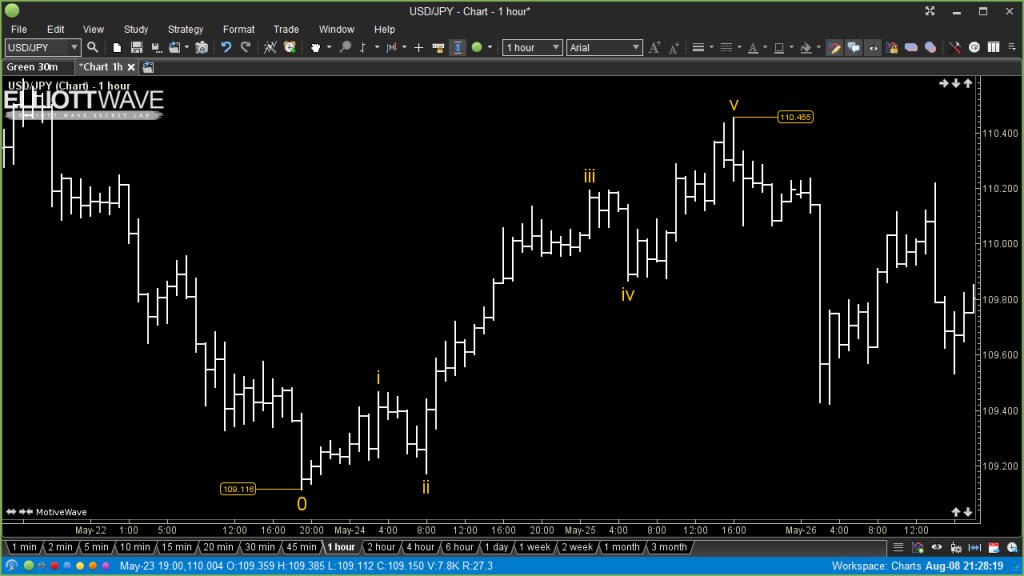
On this chart of USDJPY we have a strong and clean move upwards from 109.11 till 110.45. We can see that market moved three time higher and we only have two pullbacks before price cracked lower. We are going to label this upward move as impulsive wave i-ii-iii-iv-v.
After initial labeling we can check the rules, wave 2 was deep pullback but still never broke below the wave 1 start (rule #1 fine).
Wave 3 is clearly bigger than wave 1 and wave 5 (rule #2 fine).
Pullback in wave 4, didn’t even come close to wave 2 territory (rule #3 fine).
All of the rules where respected and after completed impulsive wave we can expect corrective phase.
Impulsive Wave Example (Bearish Market)
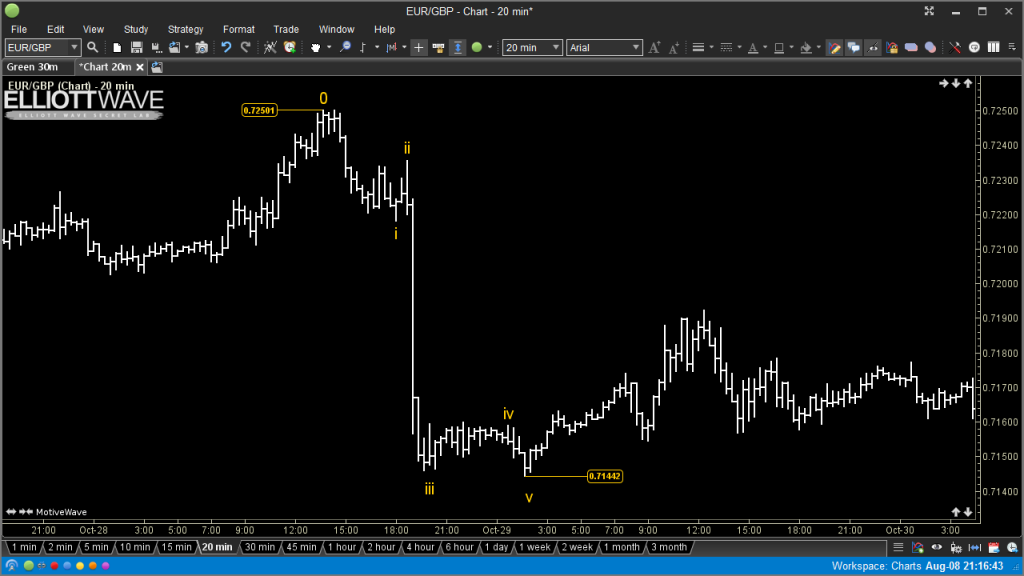
On this 20-minutes chart of EURGBP we can see a strong down trend from 0.7250 till 0.7144. After closer checking we can see that price drop over 100 pips in a motive pattern that have 5w in total. We are labeling this drop as impulsive wave i-ii-iii-iv-v.
Again to be sure that we have a valid pattern we need to go and check our three rules.
After the first drop we see a recovery that we’ve labeled as wave ii, our rules say that w.2 must hold above/below w.1 starting point, since this is down trend we are using that below as our guide. On this example wave ii never broke 0.7250 (starting point of w.i) (rule #1 fine).
Wave iii was clearly larger than waves i and v (rule #2 fine).
Wave iv took a shape of a triangle (more about triangles in corrective phase) but price holds below wave ii territory entire time (rule #3 fine).
Since all of the rules where respected we can call this drop as a valid impulsive pattern.
Extended Group
Extended Waves
Every market in the world (Stock, Forex, Commodity…) is becoming more and more volatile every single day. In recent years that has started to reflect in developing a few more waves in Motive patterns. One of the Motive waves: 1, 3, or 5, usually extends further into another five wave structure.
With these additional four waves, Extended waves take a nine-wave structure that develops in the direction of a larger trend.
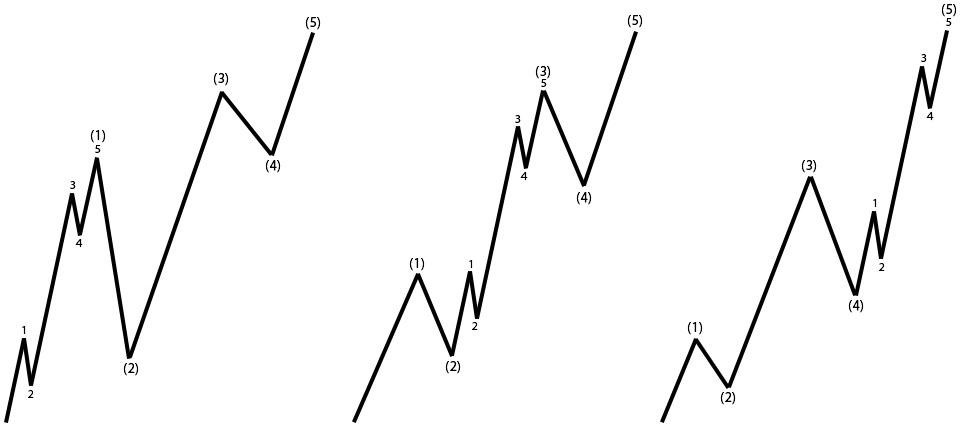
You can see on the image above how Extended waves should look if we can see Extended wave 1 (left pattern) – Extended wave 3 (middle pattern) – Extended wave 5 (right pattern).
Extended Pattern Sub Waves
The substructure of an Extended wave is the same as we have in and Impulsive pattern. We just need to take into account the additional four waves.
A sub-wave of an Extended Wave should look like this: 5-3-5-3-5-3-5-3-5
Extended Wave Rules:
- Rule One: Wave 2 must complete above/below starting point of Wave 1.
- Rule Two: Wave 3 is often the longest but never the shortest of waves 1, 3, 5
- Rule Three: Wave 4 can’t enter Wave 2 Territory
All the rules of Extended waves are the same as those we use for Impulsive waves. The important thing to remember inside an Extended wave is that we have an additional 5 wave structure, so you should double check all rules 2 times within this pattern.
Extended Wave Example (Bull Market)
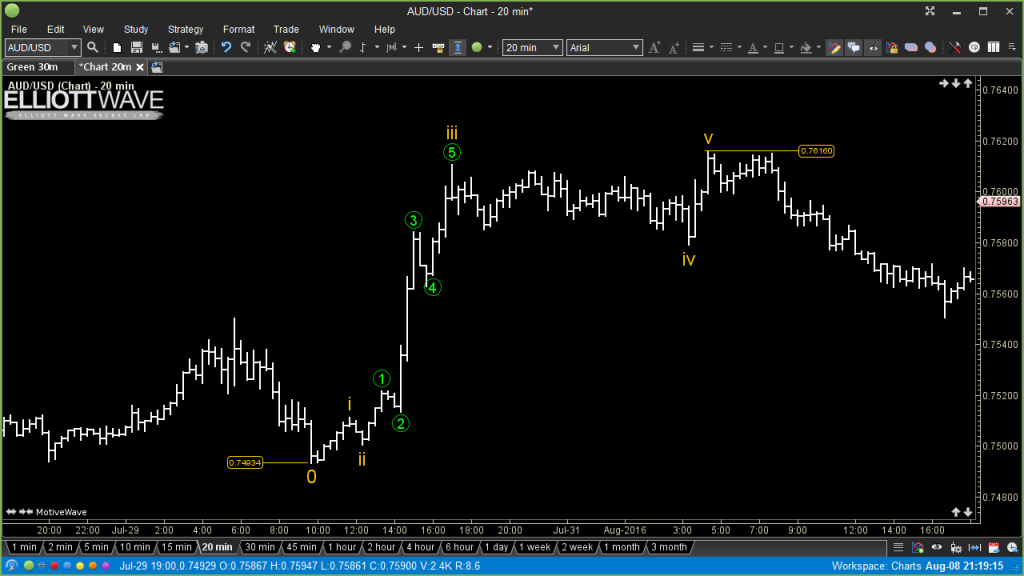
On the image above we can see 20min price action of AUDUSD pair. From the lows at 0.7493 towards 0.7616 we can see strong and sharp moves, this look at the first hand as simple motive pattern. Now after measuring each swing point (high/low) we can see that we have 9 waves in total, this is a sign that we are in extended wave pattern. With strongest moves happening in the middle, it was easy to determine that wave iii was the extended wave. We are going to label this as i-ii-1-2-3-4-5-iii-iv-v.
We now need to go and check if all rules are valid, using the rules for Extended Waves (same as for Impulsive).
Wave ii never broke the starting point of wave i, wave iii is the strongest wave and wave iv never entered wave ii territory.
Since we have 5 more waves inside wave iii, we need to check same rules again in that extended wave itself.
Wave 2 hooded above wave 1 start, wave 3 is again the strongest of wave 1-3-5 and wave 4 hooded above wave 2 territory all time.
All rules where respected in this example and we can now go and say that we have valid Extended Wave formation in AUDUSD.
Extended Wave Example (Bearish Market)
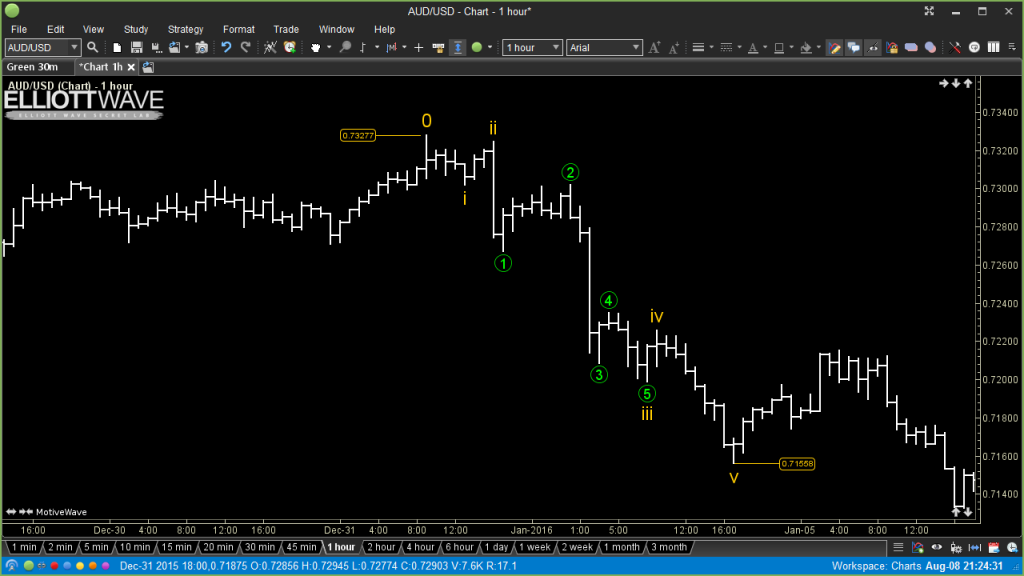
Again we are using the AUDUSD pair as example for the extended wave. On the hourly chart we can see that price was dropping from 0.7327 towards 0.7155 in motive shape. After checking how much swings we have, only result that we got was 9 swings/waves in total. Again wave iii was the extended wave, so for labeling we are using i-ii-1-2-3-4-5-iii-iv-v.
Let’s check the rules to make sure everything is correct…
Wave ii was a deep pullback but never broke above .7327, wave iii is much bigger compared to waves i and v and wave iv hooded below wave ii territory.
Wave 2 hooded below wave 1 start, wave 3 is much larger compared to waves 1 and 5 and wave 4 never tested wave 2 territory.
Again all rules where respected and we can call this a valid extended wave pattern.
Diagonal Group
Leading Diagonal
A Leading Diagonal is the first of two patterns inside the diagonal group. This pattern is going to be easy to learn and understand.
First of all I want to tell you where you can spot this pattern developing. A Leading Diagonal is only going to be valid in the early stages of the trend. Only waves 1 and A can become LD.
Again this pattern will have a five-wave structure form, where waves 1-3-5 are trend waves and move in a direction of larger trend, while waves 2 and 4 represent the short term pullback within the larger trend.
Only difference between Leading Diagonal and Impulsive wave pattern is in wave 4. In LD pattern wave 4 can test wave 2 territory (LD is usually seen in the beginning of a new trend when traders are still not ready to give up of their positions, that’s the only reason why we see deeper recovery in 4th wave of LD).
After we finish a Leading Diagonal pattern, we usually can see a deeper pullback before we spike higher.
Leading Diagonal Pattern Sub Waves
- Waves 1, 3, and 5 are going to be Motive themselves, and inside each of these three waves we are going to see another five-wave structure on smaller scale.
- Wave 2 and 4 are going to have a corrective substructure and we are going to have smaller three waves inside.
On the image above left you can see how a Leading Diagonal wave should appear in the market and on the right you can see how a full Leading Diagonal pattern can look with all the sub-waves.
Leading Diagonal Rules
- Rule One: Wave 2 must complete above/below starting point of Wave 1.
- Rule Two: Wave 3 is often the longest but never the shortest of waves 1, 3, 5
- Rule Three: Wave 4 must finish above/below ending point of Wave 2.
As you can see, we have the same first two rules as with all the other Motive patterns. The only rule that’s different is the third one. Inside the Leading Diagonal pattern, we can allow wave 4 to test wave 2 territories, but we must end above/below the end of wave 2.
Leading Diagonal Example (Bull Market)
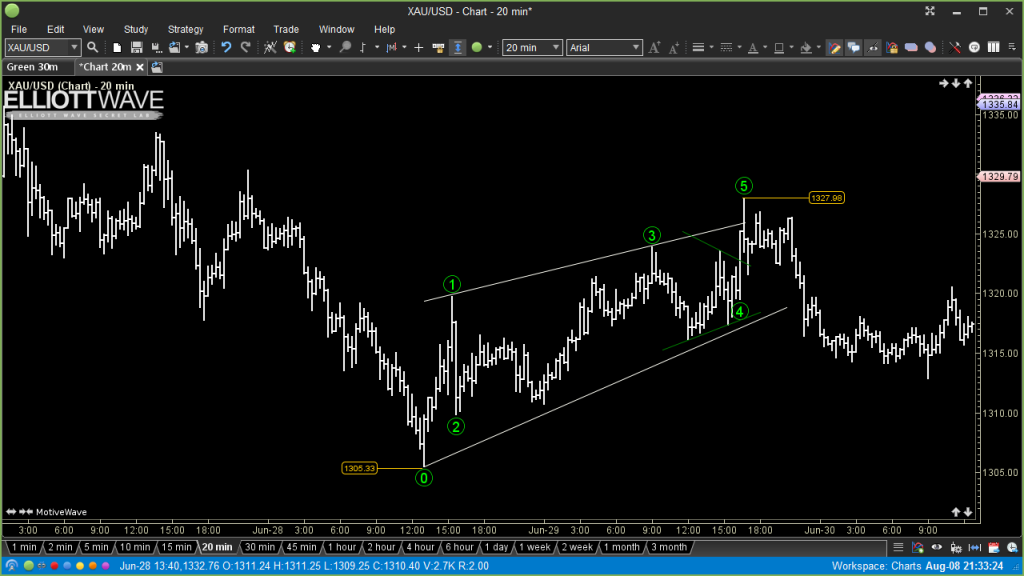
On the chart of GOLD we can see a 5-wave shape after a strong decline. We are going to label this upward move from 1305 till 1327 as motive pattern and we are heading to check the rules.
Wave 2 was deep pullback but price never broke 1305 lows (start of wave 1), wave 3 was larger than wave 5 and wave 1, but wave 4 entered the zone of wave 2.
This can’t be a simple impulsive pattern since wave 4 broke the rule, for extended wave we are missing 4 waves and we would broke the same rule, but since this 5w formation appeared after a strong downtrend we can allow this to be a valid leading diagonal just by checking one more thing.
Wave 4 entered a territory of wave 2, but we never broke below the wave 2 low, so all rules from LD where respected and we can proceed by calling this a valid Leading Diagonal.
Leading Diagonal Example (Bearish Market)
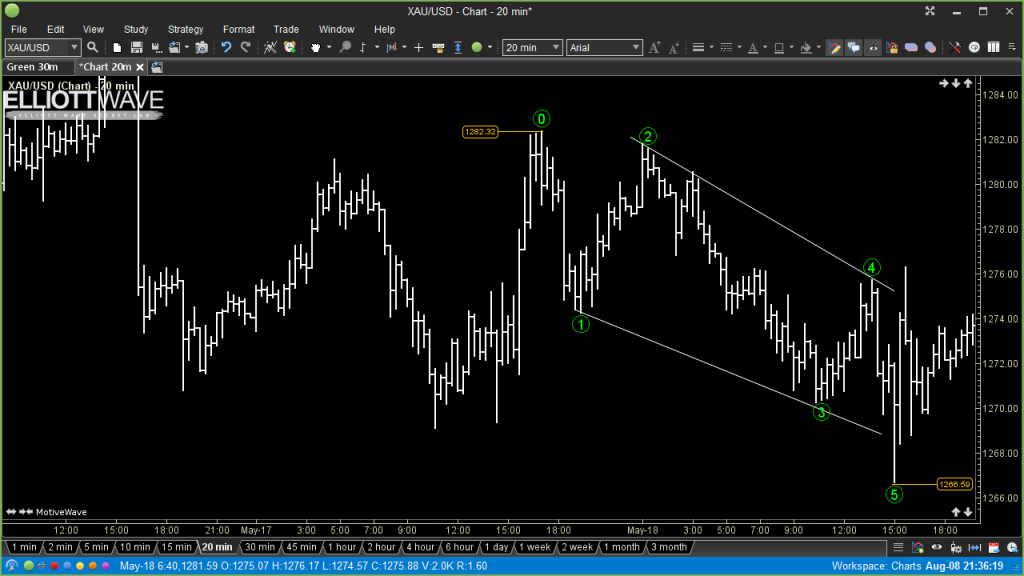
Again the image above has the GOLD as an example. We can see some choppy movements during May 17 towards 1282 that clearly don’t look motive, but during the May 18 Gold pushed down towards 1266 as 5w structure. So we’ve labeled this drop 1282-1266 as 1-2-3-4-5 and we can see on the chart that wave 4 tested wave 2 territory, so to make sure we are on the right track we need to check the rules.
Strong recovery in wave 2 almost broke the wave 1 starting point, but we never touched 1282, so rule #1 was fine, wave 3 look like the longest wave compared to waves 1-3-5 and with that we have rule #2 marked as fine.
Wave 4 just tested wave 2 zone but never broke above the ending point so that #3 rule was also ok and we can now call this a valid leading diagonal while price stay in bearish mood.
Diagonal Group
Ending Diagonal
The final pattern from this first Elliott Wave phase is an Ending Diagonal pattern. This pattern looks similar to the Leading Diagonal with few small changes.
The first big difference is where we are going to see the development of ED: we can only see this pattern in the final trend phase.
Again this pattern will have a five-wave structure form, where waves 1-3-5 are trend waves and move in a direction of larger trend, while waves 2 and 4 represent the short term pullback within the larger trend. Just like in Leading Diagonal formation, wave 4 is going to be a deep pullback that will enter the wave 2 territory. Only waves 5 and C can become ED.
Easiest way to spot an Ending Diagonal pattern on your chart will be to look for a Wedge formation. In 8 of 10 wedge patterns you can fit perfect ED pattern. Important part is that you need to see wedge developing in a direction of the larger trend (not wedge as pullback, like basic technical study teach you).
Ending Diagonal Pattern Sub Waves
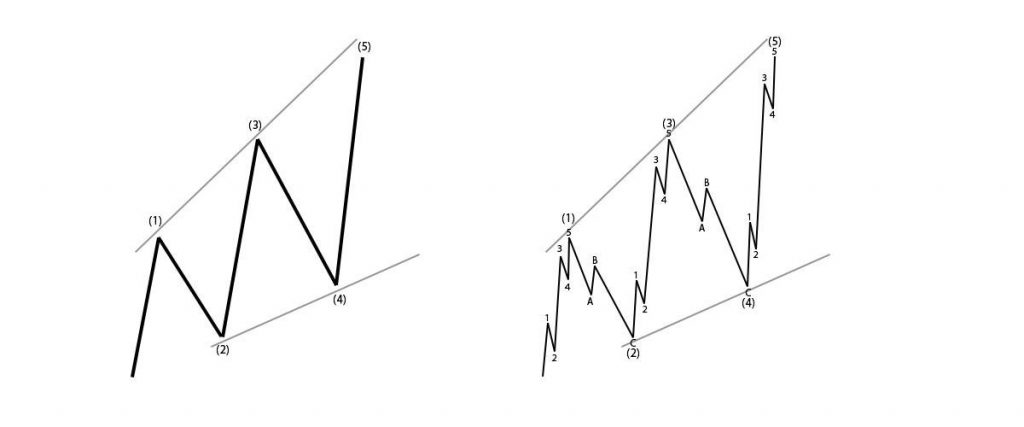
Here is where the second difference between Leading and Ending Diagonals appears. Each leg of this wave pattern will take the shape of a Corrective pattern. So waves 1 – 2 -3 -4 -5 will have a three wave substructure.
Each wave usually takes the shape of a Zig Zag correction.
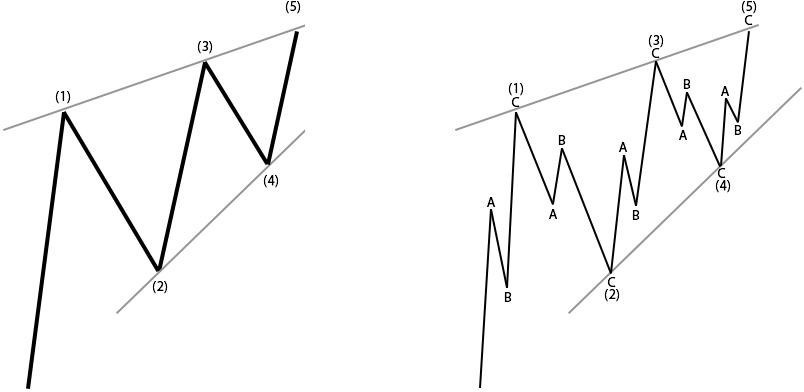
On the image above left you can see how an ending Diagonal wave should appear in the market and on the right you can see how full Impulsive pattern can look with all sub-waves.
Ending Diagonal Rules
- Rule One: Wave 2 must complete above/below starting point of Wave 1.
- Rule Two: Wave 3 is often the longest but never the shortest of waves 1, 3, 5
- Rule Three: Wave 4 must finish above/below ending point of Wave 2.
The rules of an Ending Diagonal pattern are the same as the rules we are using for Leading Diagonals.
Ending Diagonal Example (Bull Market)
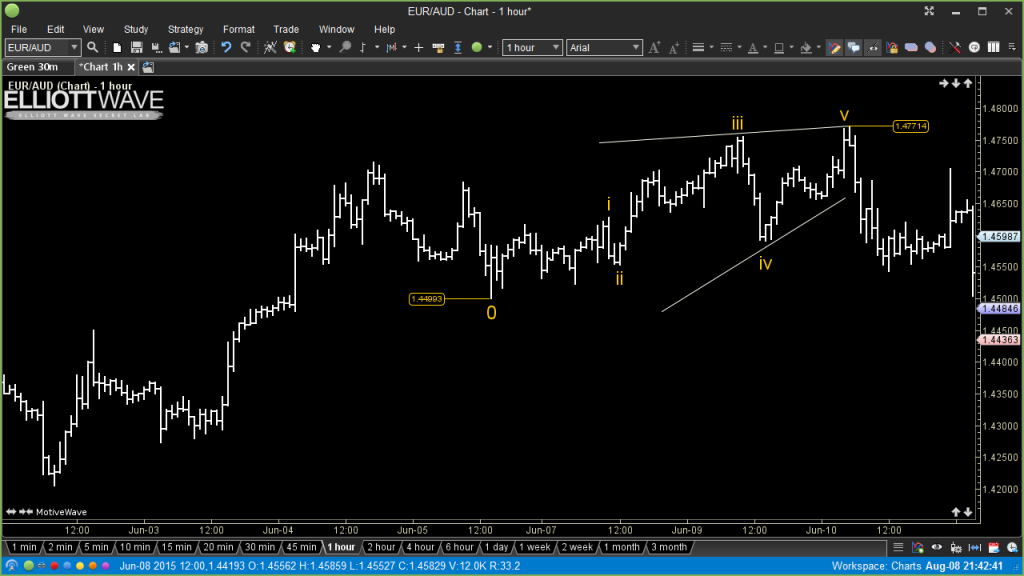
On this hourly chart of EURAUD we can see a strong upward trend from Jun-02 till Jun-10. Ending part of this trend looks like a wedge, so we are going to see if we can see an Ending Diagonal pattern here. From 1.4499 towards 1.4771 we labeled the ending diagonal as i-ii-iii-iv-v. But before we move to check the rules, I want you to stop for a moment and pay attention on sub-waves inside each leg. If everything is ok, you should see only 3w inside waves i-ii-iii-iv-v.
Now rules, wave ii managed to hold above the lows (1,4499 start of wave i).
Wave iii is larger than wave i, and that’s good enough since we only need wave iii to be larger than one of the waves i or v (but it’s good to check both, just to be sure you remember the rules).
Wave iv entered a wave ii territory but never broke below the wave ii low. All rules where again respected so we can call this a valid ED pattern.
Ending Diagonal Example (Bearish Market)
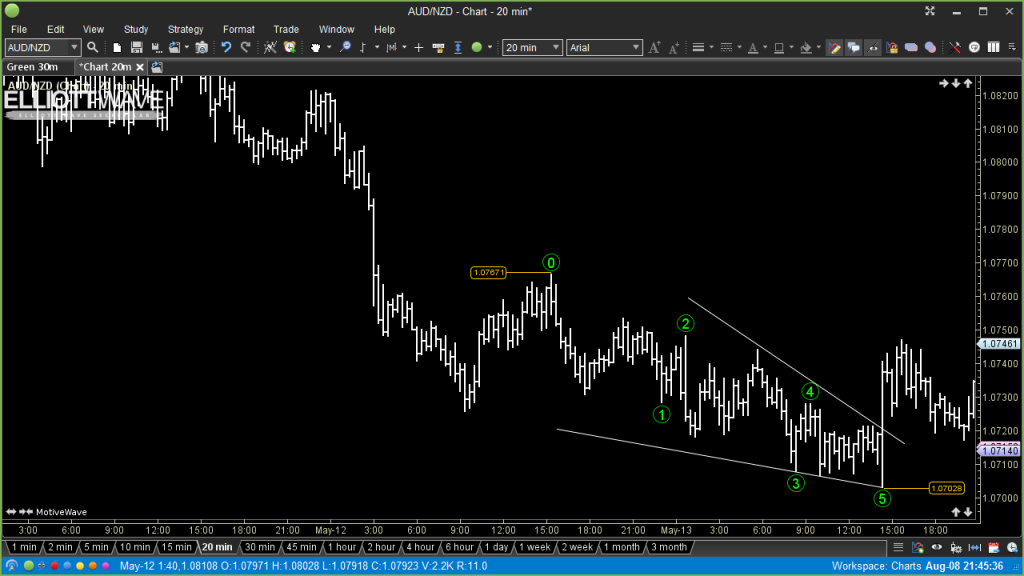
For the bearish Ending Diagonal example, we are going to look at 20minutes chart of the AUDNZD pair. We can see a strong downtrend developing and that price started to form a wedge pattern between 1.0767 and 1.0702. Again price action in that zone don’t look so strong and motive, we have a lot of overlapping waves, so an Ending Diagonal should fit perfect here. Before we move to rules you should again try to check all sub-waves inside this 1-2-3-4-5 pattern.
Wave 2 was a shallow pullback, we stayed below 1.0765, start of wave 1 all time, wave 3 looks equal to wave 1 just by looking, but it’s clearly larger than wave 5 so rule #2 is ok, wave 4 just tested wave 2 territory before a drop to 1.0702 happened so everything is ok.
You can see on this and previous example two lines, – you don’t need to draw them, but definitely they are helpful to easier see an Ending Diagonal on your charts.
What Have We Learned In This Chapter…
This chapter was full of information about Motive patterns, so before you move to the next part of this book, I want to ask you to do few things first…
I strongly suggest that you print all the rules from all four patterns and place the near your trading desk.
After that, open your charting software and try to train your eyes to search for Motive patterns. Only when you find 10 patterns that follow all the rules should you procced to the next chapter.